The Story
Zobeide is a city built by men who had a dream of a woman escaping them. Retracing the route of their dreams, they end up building a trap — for dreams who already escaped them.
1. Sketches
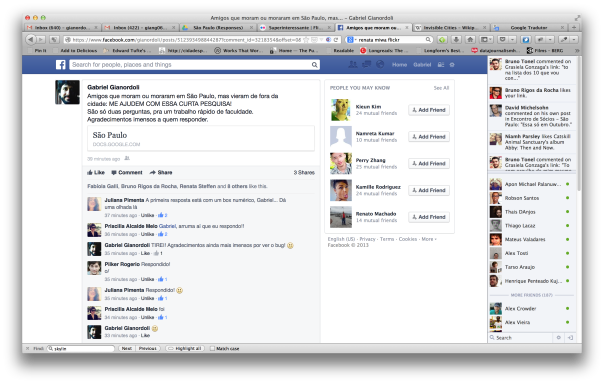
Zobeide’s metaphor reminded me of São Paulo. That made me ask myself how many of my friends moved to there in search of something? How many of them achieved their goals?
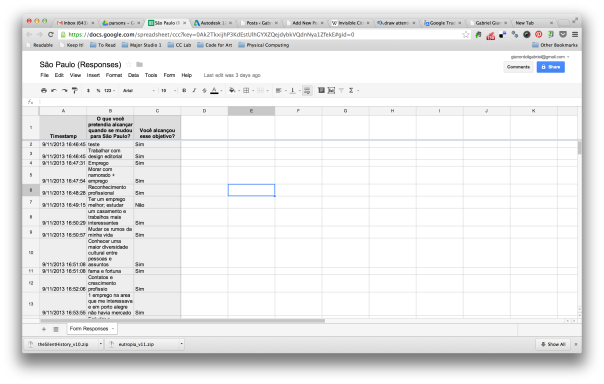
To answer that, I created a simple Google Form, with only 2 questions:
1. What did you want to achieve when you moved to São Paulo?
2. Did you achieved this goal?
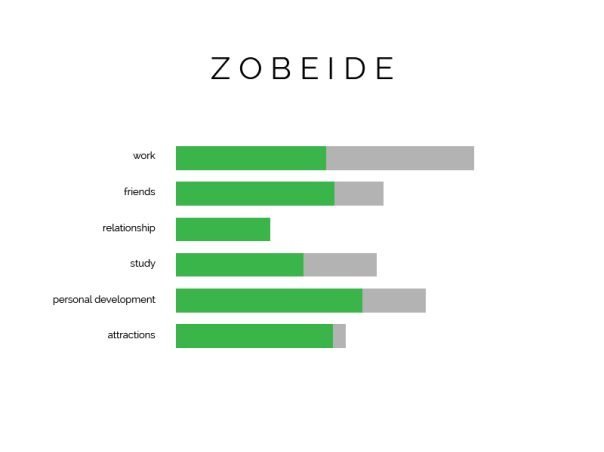
After 64 answers, I started to plan my visualization. First, I tagged the data in order to get any conclusion out of it. I found 6 categories: work, friends, relationship, study, personal development and attractions. Since there was not a limit, one answer may related to more than one tag.
Then I started coding, back to Processing again. My first idea was to display a bar graph showing each tag and its count. The percentage of yes/no would be displayed in the same bar, using color/gray.
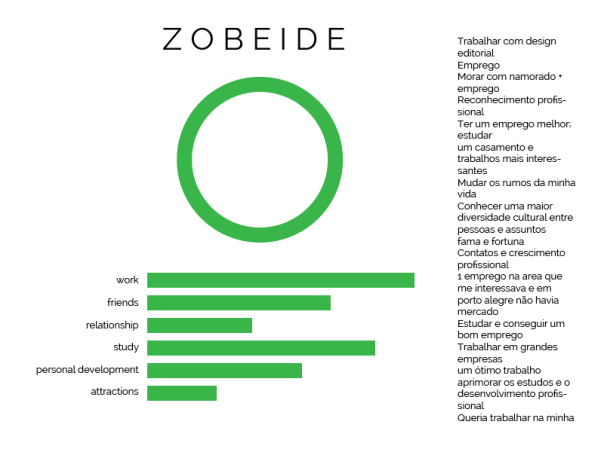
While still working on the code, I realized that this was not the best approach for the visualization. Reading the answers was important, too. So I changed it to:
– Large donut showing the total percentage of yes/no.
– Bar graph for tags and counts.
– Text area to display filtered answers (by tag or yes/no).
3. Final
I think that this is the most complete visualization of all 7 projects. Maybe because I learned a lot with the previous ones and didn’t have to struggle with basics — except for this scrollbar I had to code from scratch.
Its main feature is certainly interaction: you couldn’t show all responses or filter them in a printed page.
Working online here. 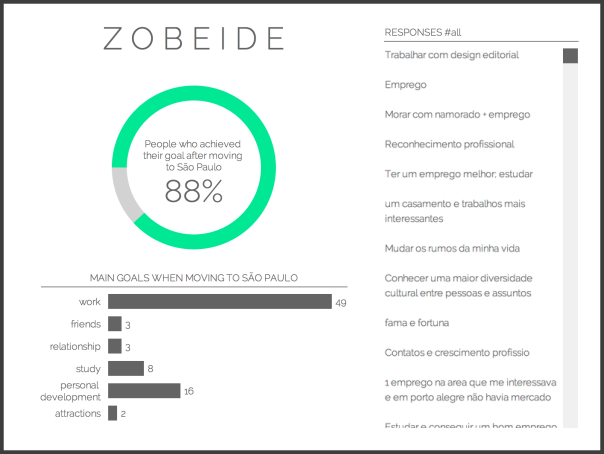
4. Notes
Though I am happy with the interaction in general, I think that clicking once again to deselect an element may not be clear for everyone. If I had more time I would also make it look better, maybe put some more colors.
At last, I would also translate the answers.
