Tag Archives: html5

Dynamic Interfaces Midterm – Playtest

In collaboration with Apon Palanuwech.

Fortunately, Playtech was happening this weekend and we had a chance to playtest the game with more people. Things worked out better than we planned: we managed to have 18 people playing at once. The mechanics seems to work nice too!
IMG_5595 IMG_55782014-04-12 14.47.26 IMG_0001 IMG_5581 IMG_5583 IMG_5585 2014-04-12 14.47.36

Dynamic Interfaces Midterm – Final

In collaboration with Apon Palanuwech.

Screen Shot 2014-04-14 at 1.12.26 PM

We changed the game mechanics to act like a sort of soccer. The first prototypes still used  the old controls, which were not very responsive. Also, allowing users to drag and rotate the bars in their phones overloaded the websockets communication.

We playtested with some friends and got to a simpler solution: use a simple swipe to move the objects. That way, the data would be sent to the server only when the users released their fingers.

To play the game, go to www.apon.io/live/pelada on your computer. Then, access the same address in your phone.

Dynamic Interfaces Midterm – Prototype

In collaboration with Apon Palanuwech.

Research
We spent weeks wondering about our proposals for this project and taking a look at different technologies that could help us — timbre.js, d3.js and SVG paths.
Then , we decided to go for the Lemmings idea and build it in one day, in a sort of hackathon.

Development
We split the team in server and client-side. Apon built the whole websockets communication and I started to build the game engine and visuals using a physics engine called matter.js.
Screen Shot 2014-04-07 at 8.43.57 PM
It was hard to mix a physics game with Lemmings, though. The bars were terribly hard to control in a gravity-based simulation. We experimented with lots of different game mechanics — get the balls with the bars, hit the balls etc — and ended up removing the gravity from the game. Even so, the controls were not responsive enough:

Dynamic Interfaces Midterm – Proposals

In collaboration with Apon Palanuwech.

a) Worm Tunes
A visual music synthesizer, inspired by the amazing Patatap. Users can draw their musical “worms” on their phones. Shapes and curves would be translated into sound and then plugged to the last segment of the collective worm. The final result would be a collective piece of music and drawing.
worm_tunes

b) Help the Tribe
A Lemmings-like game. Users control virtual bars from their phones and should help the “tribe” — a bunch of rolling balls or polygons — overcome the obstacles and reach the final goal.
help_the_tribe

Visualizing New York’s Weather

Idea
People are always saying that “last year wasn’t as cold as it is now” or “20 years ago you didn’t had that much rainy days in September”… What if they could actually make those comparisons?

1. Data
I worked with the data from the Wunderground API. First, it gets three variables from today’s weather: temperature, high and low.
To make a proper comparison, I would have to calculate month or seasons average from previous years. I don’t know exactly what would make more sense. Also, my API account allows for a limited number of searches in the database. So, it would be impossible to search for several days/months/years.
Instead, I chose to make a comparison between today and this same date in a specific year. The user can choose from 1963 to 2012 (yep, 50 years was an arbitrary choice).

Screen Shot 2013-10-10 at 6.37.58 PM

Wunderground’s API also provides you what it calls “almanac”. It is a list of historical variables for that date, like normal high, normal low, highest temperature ever and what day it happened.
I though that normal high and low would provide a reasonable parameter for comparisons.

Screen Shot 2013-10-10 at 6.38.07 PM

2. Visualization
This is a very simple line graph. The intention is to show how those 2 days compare.

Screen Shot 2013-10-10 at 6.30.00 PM

The “normal historical” temperatures serve as a base for the comparisons. Two things needed improvement:
– make clear that the historical value is a secondary data;
– adjust the scale so that the main data is always readable.

Screen Shot 2013-10-10 at 6.46.44 PM

3. Final
I did some color adjustments and added another scale to make it easier to read.
Click here to try it yourself.

Screen Shot 2013-10-10 at 6.47.15 PMOriginal post: http://teaching.jos.ph/cclab2013/2013/10/10/visualizing-new-yorks-weather/

Dusty HTML Canvas

Idea
Make my dusty project for the Code for Art class work on  a browser, too.

Technical hurdles
I began with the wrong approach: pasting my own code and changing the syntax from openFrameworks to javaScript. It took a long time to work.
I stepped back then and made a simple exercise with arrays and objects. I assigned different colors to an object and assigned it to and array:
Screen Shot 2013-10-03 at 5.02.15 PMIt’s hard to believe that you can assign anything to an array element in javaScript. The code for that was:

for(var i = 0; i < myArray.length; i++){
var myColorObject = new Object();
myColorObject.red = i;
myColorObject.green = 255 - i;
myColorObject.blue = 200;
myArray[i] = myColorObject;
}

Then I got back to the “dusty” code and finally figured out a way to make it work.

Screen Shot 2013-10-03 at 4.58.56 PM

Final
Working here (doesn’t work on Firefox; works faster on Safari).

Notes
1. At first, I used setInterval. But it seemed that the mouse response was slower with that. Dragging the mouse would leave separate circles in the surface, instead of a regular flow. I changed it to mouse move, then.
2. Even so, it doesn’t work as fast as in openFrameworks. I tried a lot of different things — changing the square size, decreasing the number of particles etc. That was the best I could get.
3. I was using the same code as in the previous assignment to make the canvas resolution look better in retina displays when in Chrome and Firefox. That probably added extra processing to it and slowed down the particles, since it doubles the pixels and then shrink them again. I removed that. I recommend testing it on Safari.
4. Interaction doesn’t work on Firefox. I have no idea why.

Original post: http://teaching.jos.ph/cclab2013/2013/10/03/gabriel-gianordoli-week-3/

Interactive Canvas

1. Idea
Make an interactive pattern. Elements should interact with both mouse’s move and press.

2. Precedents
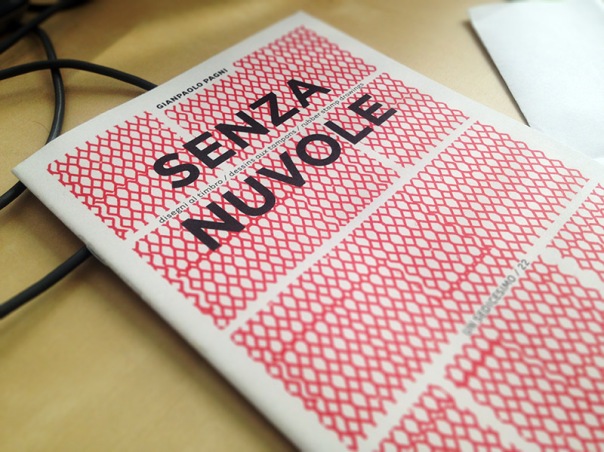
I love patterns. I was reminded of that when I bought this beautiful issue of Un Sedicesimo featuring Gianpaolo Pagni last weekend on NY Artbook Fair:


gianpaolo_2gianpaolo_1

I especially like the way screen printing affects the interaction of color, like in Karel Martens works:

tumblr_mcepyv1Qfv1ru82ue tumblr_mcf0srNkUm1ru82ue

I wanted the mouse interaction to add a similar effect to my digital pattern.

3. Code
a) Make an array of squares, given a number of columns and lines.

pattern_1

b) Map the colors to the array index — I miss Processing’s map() function! Note: when using variables with color settings in canvas, you have to concatenate them:
ctx.strokeStyle = 'rgb('+ r +', 150,' + b + ')';

pattern_2

c) Draw squares in different angles according to the mouse position. I used javaScript atan2 function.

d) Draw squares in different sizes according to their distance to the mouse (when pressed). I miss Processing’s dist() function. Using javaScript sine and cosine instead.

Html working here.

4. Notes
This is not relevant, but there was an annoying thing in the page so far: Chrome and Firefox render badly the canvas element on a Macbook Retina.  I found the reason and the solution for that in this article and added it to my code.

Original post: http://teaching.jos.ph/cclab2013/2013/09/24/gabriel-gianordoli-week-2/